Census data as ready-to-use GIS layers.

Pull American Community Survey, Decennial Census, population estimates, LEHD jobs and migration flows straight into Shapefile, File Geodatabase, KML or CSV, with boundaries attached. Analyze them in the browser. Print them to a map layout. No R, no Python, no API wrangling.

Sign in Request access
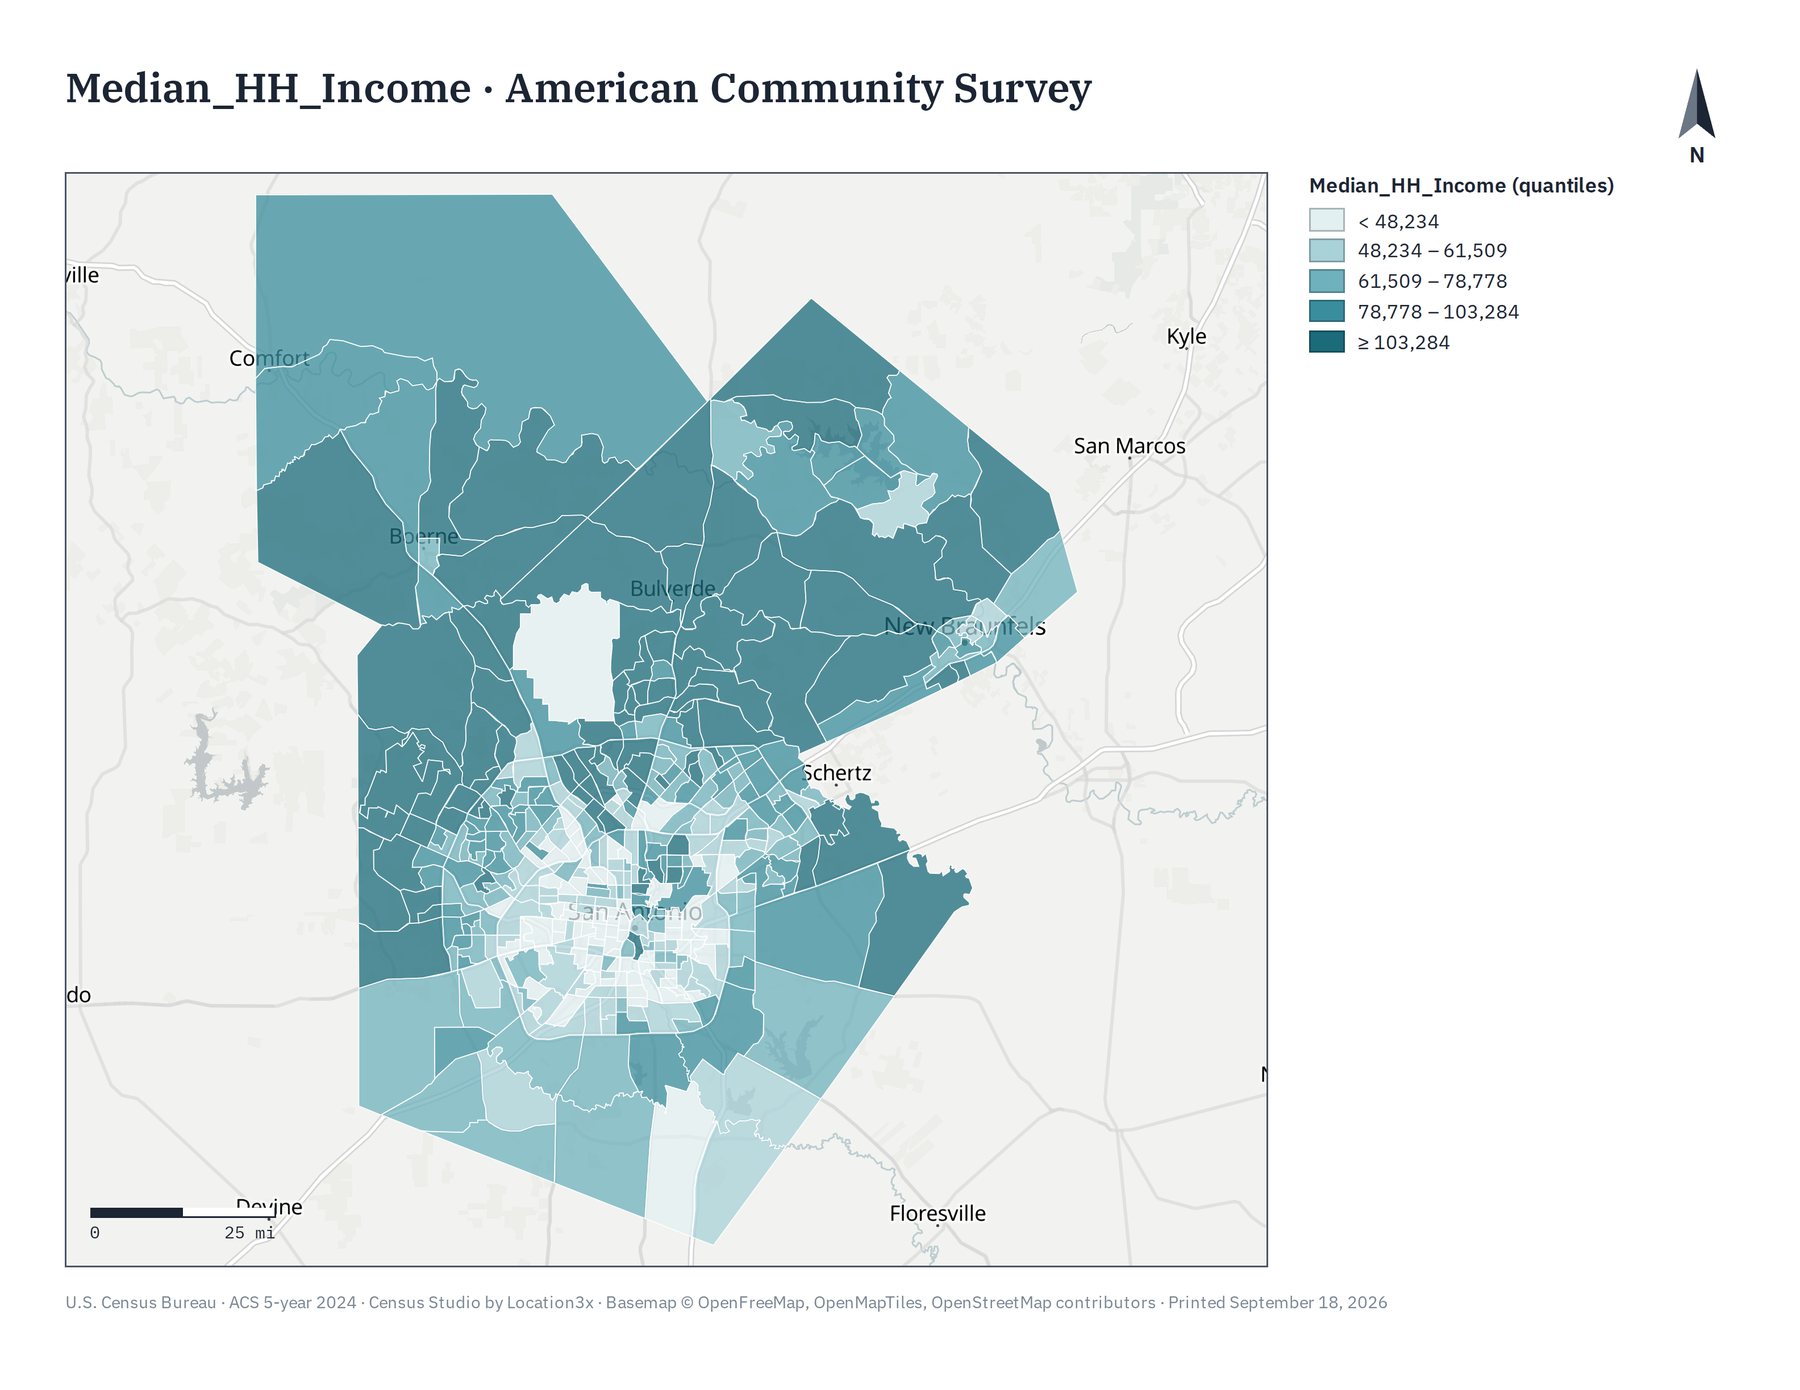
A printed Census Studio map of median household income by census tract around San Antonio, with legend, scale bar and north arrow
Median household income by tract, San Antonio. Letter-landscape layout printed from Census Studio.
1

Download

Pick a year, a geography and the variables you need. Census Studio fetches the estimates, the margins of error and the TIGER boundaries and hands you one clean layer.

2

Analyze

Join ACS data to your own polygons, run Getis-Ord hot spot analysis, compare two time periods with boundary crosswalks, aggregate to any target, normalize with proper MOE propagation, filter by reliability.

3

Deliver

Every result maps in the browser with ColorBrewer ramps and natural-breaks classes, downloads in six GIS formats, and prints to PDF in six layout templates with legend, scale bar and source line.

Thirteen tools, the same ones in the ArcGIS Pro toolbox

Census Studio for the web runs the same tested workflows as the Census Studio ArcGIS Pro toolbox, without needing ArcGIS.

Census downloads

  • ACS estimates 5-year and 1-year, 2015 onward, any geography from state to block group
  • Decennial Census 2010 and 2020 population, race, housing
  • Population estimates Annual county and state estimates by component
  • Migration flows County-to-county inflows and outflows
  • LEHD jobs and commute flows Workplace and residence job counts, home-to-work flows

Analysis

  • Compare time periods Change between ACS vintages with tract crosswalks
  • Join ACS data to features Enrich your own polygons by GEOID or location
  • Hot spot analysis Getis-Ord Gi* with margin-of-error adjustment
  • Aggregate data Sum, mean or share from one geography to another
  • Demographic profile report Study area versus county, state and nation

Data transformation

  • Normalize data Percentages, rates per 1k/10k/100k, ratios, with Census Bureau MOE formulas
  • MOE reliability filter Coefficient of variation, High/Medium/Low classes, flag or remove

Output formats

ShapefileFile GeodatabaseKMLCSVGeoPackageGeoJSONPDF map layouts

Simple credits, no seats to count

Every run costs one or two credits and finishes in seconds to a few minutes. New accounts start with free credits so you can see real results before paying anything. Subscription plans and pay-as-you-go credit packs are being finalized; if you'd like early access, send a note and we'll set you up.

Request early access Sign in